Hey guys. It's been a while since my last post here, but we did a good job meanwhile. Beside implementing the features I have described in my previous post I have implemented some other useful features/additional options. Let's see what we have here.
First of all I'll just list the options that are implemented already and in the end I'll talk a bit about the next steps.
- Source type
- File or named pipe
- Network TCP socket
- Network UDP socket
- Local socket
- Serial port
- Reading type
- Continuously fixed
- From end
- Till the end
- Update type
- Periodically
- On new data
- Keep last N values
- Update now
- Pause/Continue
- Update interval
- Sample rate
As I told you, for "Periodically" update type the user has to provide a value in milliseconds (planning to extend this to other interval types such as minutes, formatted time values..). For "Continuously fixed" and "From end" reading types the user has to provide a value which is the sample rate. On every update we'll read sample rate number of samples if they're available.
The option that I had no words about in my previous post is the "Reading type" one. Let's think a bit, if we have a device that sends lots of data then we may want to check only a piece from the end of the data. For this we have the "From end" reading type. It's possible that we want to observe continuously this new data, but read just some samples at a time. For this we have the "Continuously fixed" reading type. Also it's possible that we need all of the new data every time we update. In this case we have a third reading type, this is the "Till the end" one. For the "Continuously fixed" and "From end" the user must provide a value (sample rate) to tell LabPlot how many lines he/she wants to read on every update. No worries if the user enters a larger number than the actual new lines, we'll read just as much as we have in that case.
Using our new LiveDataDock we allow users to change almost every option while doing the actual reading. Only the "Keep last N values" cannot be changed, because if we use that we want to have a fixed size that's not changing.
The new reading type option in "action":
 |
| Reading types |
After creating the FileDataSource we get the newly implemented LiveDataDock. For "Till the end" as I said we don't need sample rate, so in that case LiveDataDock looks like this:
 |
| Till the end reading type selected |
But if the "From end" reading type is selected then the Sample rate line edit shows up:
 |
| From end reading type |
In the other hand if the user wants to read the new data only if there is actually new data then this can be done as explained in my previous post, using the "On new data" update type:
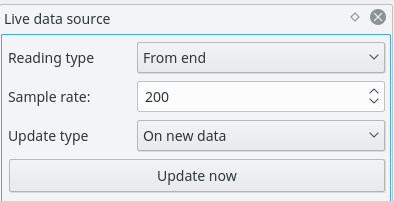 |
| From end with On new data |
For almost every of the newly implemented features I have an example video which was made right after I got it working.
In this video I'm presenting the use of the "Update interval" option.
This video is about changing the sample rate and pausing/continuing the reading.
The "Update now" button is presented in the video above.
This one demonstrates the "Keep last N values" option in action.
As you can see I have spent lots of time in these demo videos with the plot setup. We knew we need to speed up this procedure, so one of my mentors (Alexander Semke) implemented the PlotDataDialog for FileDataSources and so in just 1-2 clicks we can get our data plotted nicely.
Then I came up with an idea which I thought we need for live data, but as we talked with Alexander I realized that this feature is useful for static data too. This feature is the data ranging, which consists of setting the plot's X min and max values to a calculated one. We get this value after providing the number of samples we want to see plotted from the end or the beginning of our FileDataSource. This feature is currently in development, but it will be soon working. This new feature is added to the CartesianPlotDock:
 |
| CartesianPlot data range |
The "Free ranges" data range will be the same as it was available in LabPlot before. For live data sources the "Show last" option makes more sense, but in case of fixed sized FileDataSources even the "Show first" option can be useful. These options take a value which means the number of samples to be plotted. Using "Show last" we can watch the latest N new samples plotted. As I was thinking about this feature I "hacked" a fast prototype to demonstrate my idea about the "Show last" option to Alexander, you can check it here:
Here I'm using the PlotDataDialog for FileDataSources, you can see the difference I guess :).
About the source types: we need to learn a bit about the data extraction from sockets and every source type should be working just fine.
About the next steps, there can be lots always. The first steps are to fix the data extraction from sockets. After this we will be working on optimizing the data plotting which wasn't really designed for growing/frequently changing data, but we'll try our best to make LabPlot better and faster :)
This was for now folks, thanks for your attention, check out LabPlot! See you! :)